NetMotion Brings Operational Intelligence to Cloud Connected Devices
NetMotion’s Operational Intelligence for Enterprise Mobility brings forth a plethora of actionable data for cloud-connected mobile devices.

Connectivity issues often rear their ugly heads at the most inopportune times, leaving MSPs to address the causes and act on the effects, which is sometimes an impossible task. The key to solving connectivity problems comes in the form of data, or more specifically, real-time data that can be analyzed and presented in a visual manner.
“Having a better understanding of mobile-device and data usage is proving to be critical for us to support our clients,” said Kevin Shakil, COO at Instant Solutionz. “The increase in cloud-based applications, coupled with mobile devices, has limited our view into what is actually occurring across our clients’ devices, potentially creating blind spots that can impact support.”

Kevin Shakil
NetMotion aims to become that font of actionable intelligence with a cloud-based solution that goes by the moniker of Operational Intelligence for Enterprise Mobility, a rather unwieldy name for a powerful solution that can tame numerous connectivity problems. Although the product specifically includes mobility in its name, it also proves valuable for capturing data and analyzing device connectivity, even if those devices are not on the go. The primary concept behind the product is to give enterprises visibility and control of connected devices, with the added capability of dealing with devices in motion. The product works using a client-server style architecture, where a small client application is installed on each endpoint, allowing connectivity metrics to be reported back to a centralized system in real time. But gathering and presenting connectivity data is only one part of the equation. The product also offers the ability to take automated action based upon defined policies and executes those actions based upon thresholds. Operational Intelligence for Enterprise Mobility is designed to address three primary operational areas, broken down as performance, threat defense and cost control, each of which is supported by an integrated dashboard giving a visual representation of the related activity in real time. For example, the performance dashboard offers views into what is connected, the throughput of the connected devices, as well as latency and other metrics.
Performance
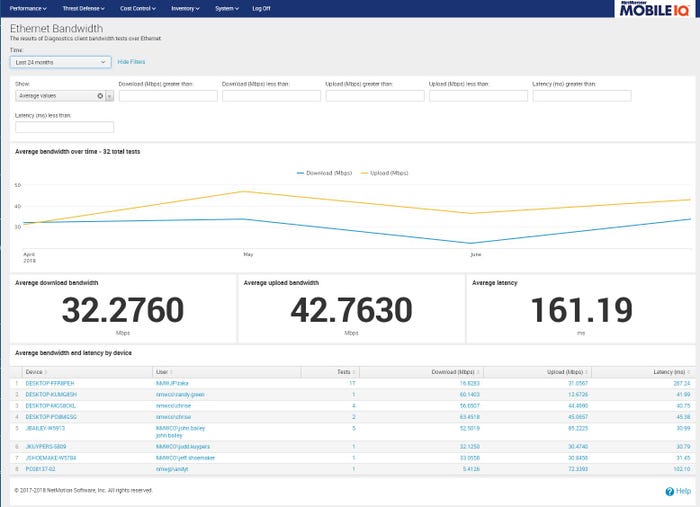
NetMotion’s product measures various elements to give insight into performance. Real-time snapshots of network health, network failures and bandwidth measurements are presented in a fully customizable dashboard. The dashboard includes visualizations for network health, bandwidth, network failures, connect failures and diagnostic reports. Each performance dashboard supports drill-down capabilities, allowing operators to garner information from individual endpoints, connections, or most any other element related to performance. Other tools allow administrators to sort and filter performance data by date ranges or connections, making it easy to identify outliers and exceptions. That information proves to be quite valuable when looking at connectivity issues, or even recreating views related to performance problems. MSPs can use that information to identify connections that aren’t performing as defined by SLAs, giving them the ability to negotiate better rates with telco or cellular service providers. What’s more, the gathered data and related analytics can be used to better tune performance based upon connectivity choices, while also measuring the impact that infrastructure changes have on performance.

Threat Defense
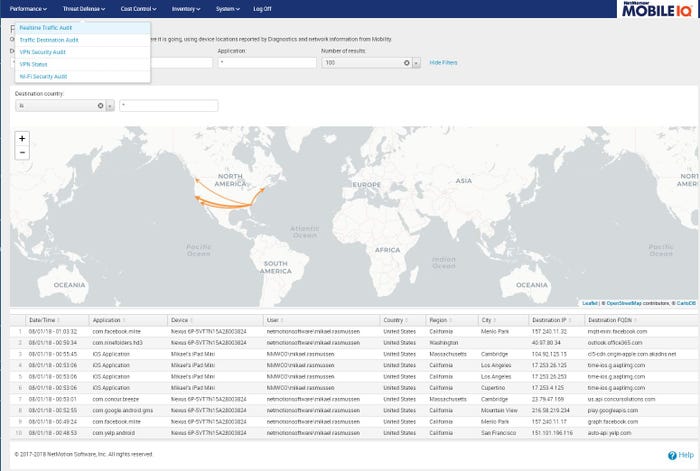
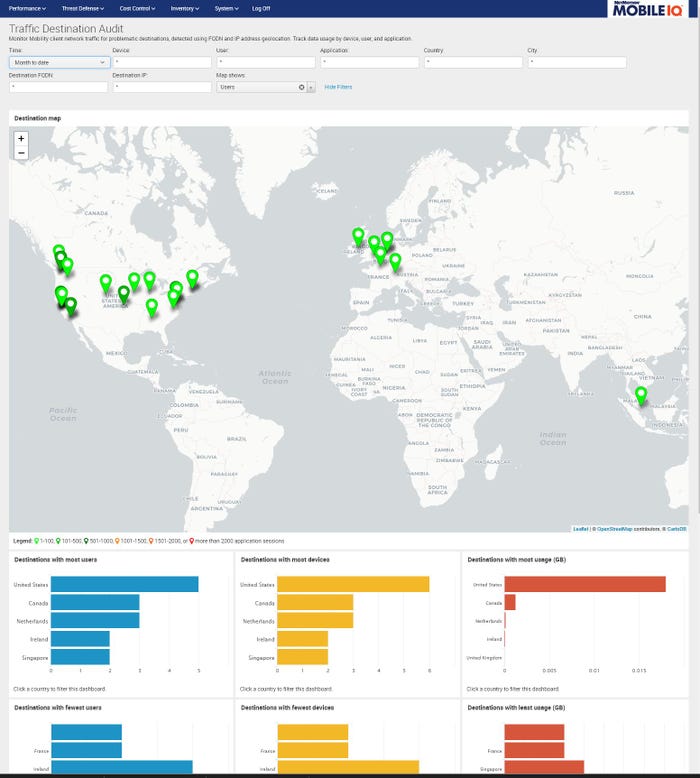
It’s pretty much a given that adding remote or mobile devices to a network results in a much larger landscape of threats. Simply put, every device that connects to the host network can become a point of entry for malware, malicious activity, or the numerous other threats that plague networks today. NetMotion provides several dashboards that are designed to identify threats and inform administrators of the severity of those threats. The Threat Defense dashboards include a real-time traffic audit, traffic destination audit, VPN security audit, VPN status and Wi-Fi security audit.

Each of those dashboards provides detailed information on network activity as related to security concerns. All critical information is listed in tables and columns on the dashboard and supports full drill down. Elements such as domains, devices, users and locations are readily displayed, along with a graphical representation of a world map. Administrators can quickly identify the top consumers of traffic, as well as the physical locations, allowing them to get a better handle on potential threats. Visualized reports, such as the VPN security audit, offer a critical lens into devices connected without VPNs and how those devices connected, allowing administrators to set up better threat mitigation techniques.

Cost Control
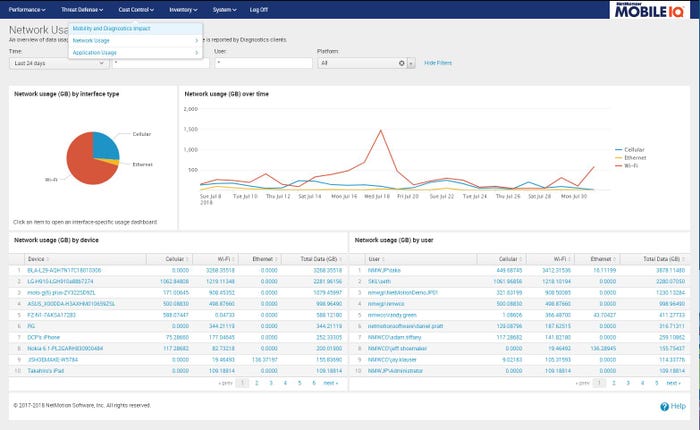
As more mobile and remote devices are connected to a network, it becomes critical to measure the cost of that connectivity. Many businesses overspend on connectivity, while others don’t spend enough. Naturally, overprovisioning can be equated to wasted money, but knowing how much is being wasted becomes a critical consideration when budgeting for growth. NetMotion provides several dashboards that focus on revealing the true costs of connectivity. Those dashboards include mobility and diagnostic impact, network usage and application usage. The ability to account for the bandwidth being used for applications and devices becomes one of the most important metrics for deciding how much bandwidth should be purchased. The product allows users to breakdown network usage by different types of connections – cellular, Wi-Fi and Ethernet – over time, allowing administrators to determine the peaks and valleys of usage and relate that to connectivity costs. One of the most valuable dashboards is focused on application usage, which in today’s cloud-connected world could help to quickly identify more cost-effective options for hosting applications.

Conclusions
MSPs looking to get a better handle on connectivity, devices, mobile users and remote connections will be well served by the analytics offered by NetMotion’s product, where the gathered data is quickly organized into easily understood reports and dashboards. That said, the product offers numerous other features and capabilities when fully implemented with NetMotion’s full suite of products.
“Having the ability to calculate bandwidth-consumption costs, as well as drill-down into security concerns, gives us the potential to reshape how connectivity is provided while reducing costs. Improving support should prove extremely valuable to a business like ours,” said Shakil.
About the Author(s)
You May Also Like


